Automatic tilt analysis :: User Manual
Contents
The method and program
The Automatic Tilt Analysis Program (ATAP) is an implementation of a computational procedure described by Rosenthal & Henderson (JMB 2003) for assigning the absolute hand of density maps determined by single-particle electron microscopy that is applicable to optimising orientation determination and map validation.
The procedure requires a pair of micrographs of the same particle field recorded at two tilt angles of a single tilt-axis specimen holder, a three-dimensional map, and set of orientation parameters for the untilted particle images. The program also requires values for parameters related to the experiment such as: magnification, defocus, microscope voltage, particle size and tilt range for a search.
Starting with the untilted orientation for each particle, the program predicts a set of tilted orientations to cover the requested search range. The model is projected at tilted orientations and the projections are aligned translationally against the tilted particle image, yielding a map of the Fourier phase residual values for all predicted orientations (Fourier Phase Residual Landscape).
The Phase Residual Landscapes for all particles are averaged yielding the Average Phase Residual Landscape. For correctly determined particle orientations the Average Phase Residual Landscape minimum is expected to agree with the known tilt angle and axis of the experiment. The quantitative discrimination of correct from incorrect hand is given by the free hand difference value.
Input
- Experiment parameters:
- Magnification
Angstroms per pixel or microscope magnification and densitometer step - Voltage of the microscope [kV]
- Defocus [Angstroms] and astigmatism [degrees]
- Tilt angle search range [degrees]
- Particle radius for an automatic circular masking [in pixels]
- Resolution range for phase residual search [Angstroms]
Min: 500A; max: 10A. Recommended for most cases: 100A – 30A;
If only an approximate defocus value is known you should enter the same value into both defocus fields and set the astigmatism to zero.
Positive defocus value equals underfocus.A range of tilt angles determining a size of the Phase Residual Landscape. Should be around 1.5x of the tilt angle from the microscope’s goniometer.
Min: 5 degrees; max: 60 degrees.Particles are masked with a circular soft mask to reduce noise impact on the Fourier phase residual calculations. The radius of the mask is 1.5x of the radius of the molecule. For example by setting the particle radius to 30px the mask radius will be 45 pixels. The images are also padded according to the mask radius (see the Algorithm section for more details).
If the radius is set to 0 or a value greater than half of the box size the program skips the masking and padding step. - Magnification
- User information:
- Valid e-mail address
The results will be sent by the e-mail (a link to the results page).
- Experiment identifier
Any arbitrary text to help you identify the results.
- Required datasets:
- 3D model to be validated
- Untilted and tilted stacks
- Parameters for the untilted film
The model must be submitted as a MRC file with all dimensions equal and even.
The program expects density to be represented by a white colour.
The program expects MRC stacks of raw images from ice without CTF correction or masking. Particles must be dark on light background in square boxes of the XY size the same as the size of the model.
Recommended number of particles: 50 – 100
A text file with orientation parameters determined using the same program as the one used to make the reconstruction (output files from Frealign and Spider).
Example: Frealign-compatible input parameter file
 C PSI THETA PHI SHX SHY MAG FILM DF1 DF2 ANGAST PRESA

23 93.64 148.89 63.25 0.925 -2.324 54100. 1009 49000.0 47000.0 61.00 52.56

24 164.68 321.80 48.53 2.418 0.775 54100. 1009 49000.0 47000.0 61.00 52.01
The program expects a text file with a single line per particle. The number of lines must match the number of particles. Empty lines and these starting with “C” are ignored. The format of a parameter line is defined in card10.f of the Frealign source code. The C/C++ equivalent is:
"%7u%8.3f%8.3f%8.3f%8.3f%8.3f%7.0f.%6i%9.1f%9.1f%8.2f%7.2f"
and specifies the following fields:
- ID (integer, 7 digits)
- PSI (floating point, 8 digits in total with 3 decimal digits)
- THETA (floating point, 8 digits in total with 3 decimal digits)
- PHI (floating point, 8 digits in total with 3 decimal digits)
- SHX (floating point, 8 digits in total with 3 decimal digits)
- SHY (floating point, 8 digits in total with 3 decimal digits)
- MAG (floating point, 7 digits in total with 0 decimal digits)
- FILM (integer, 6 digits)
- DF1 (floating point, 9 digits in total with 1 decimal digit)
- DF2 (floating point, 9 digits in total with 1 decimal digit)
- ANGAST (floating point, 8 digits in total with 2 decimal digit)
- PRESA (floating point, 7 digits in total with 2 decimal digit)
Serial number of the particle (ignored by the tilt server)
Rotation about Z axis, degrees.
Rotation about Y axis, degrees.
Rotation about Z axis, degrees.
X translation (ignored by the server)
Y translation (ignored by the server)
Magnification (ignored by the server)
Film ID (ignored by the server)
Defocus in Angstroms (ignored by the server)
Defocus in Angstroms (ignored by the server)
Astigmatism angle (ignored by the server)
Phase Residual value (ignored by the server)
The server expects all column to be present, even if the values are ignored (for validation purpose). Any extra columns will be ignored.
Results page
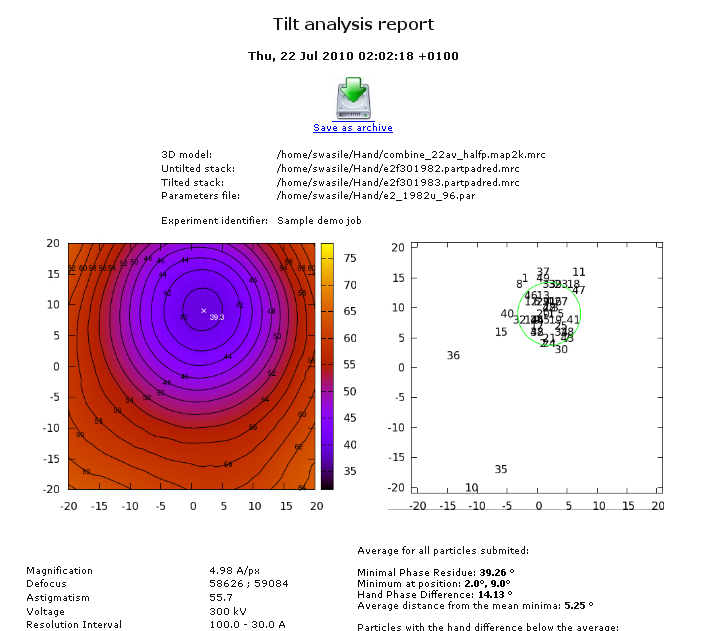
The URL to the results page is sent by the e-mail to the address provided at the job submission. The result page contains the following sections:
- Job information;
- Average phase residual plot and a plot showing the position of minima for all submitted particles;
- Information about the results:
- Position and value of the AFPL minimum;
- Width of the minimum;
- Free hand difference between the minimum and orientation corresponding to the opposite hand;
- Lists of particles:
- having the Free hand difference below the value determined for the Average Phase Residual Landscape (marked red);
- with the Fourier phase residual minimum further than 1 variance from the minimum of the AFPR (marked red);
- particles that contributed to the Average Phase Residual Landscape minimum and have the free hand difference above the average (marked green);
- Detailed information on each particle:
- Pairs of images after CTF correction and masking;
- Projections match:
- Projection corresponding to the untilted particle, generated based on the submitted parameters (a control image);
- Projection at the determined orientation corresponding to the minimum of the Phase Residual Landscape (in an ideal case should agree with tilted image);
- Position and value of identified minimum of the Phase Residual Landscape;
- The value of the free hand difference
Data privacy policy
- We do not keep submitted models and original data stacks after the calculations are finished. The only data stored (for a limited amount of time) on the server are JPEG compressed and reduced images of the particles required to generate display of a results page.
- The submitted model and stacks are only subject to the automatic processing with no human intervention at any time.
The algorithm
- CTF correction by a phase flipping
- Binning to the optimal resolution
If the maximum resolution for the Fourier phase residual calculations lies further than 1/4 of Nyquist the box is binned by an integer factor required to shift the maximal resolution to lie around(*) 1/4 of the Nqyuist.
(* “Around” is defined as +/- 15% of the new reciprocal radius).
The same binning factor applies to all data.
- Low pass filtering to the maximum resolution of calculations
- Centering the stacks against a sum of the images
Images are centered using a cross-correlation with integer pixel shift (no interpolation involved).
- Masking with soft-edge mask
The mask radius is set to 1.5x of the size of the molecule. The cosine softened area corresponds to the 6% of the box size (min. 5 px).
The same mask applies to the model.
In the radius is zero or is greater than a half of the box size the masking is omitted.
- Padding of the stacks and the model
The stacks are padded with zeros to provide an optimal amount of space to freely move the particle. The new size of the box is set to 1.5x the mask radius.
The same padding conditions apply to the model.
In the radius is zero or is greater than a half of the box size the padding is omitted.
- Prediction of the tilted orientations
The tilted orientations are predicted for each particle based on the submitted untitled orientations.
The new set of orientations is generated by the following algorithm (pseudocode):
vector predictOrientations(Quaternion untiltedOrientation,

float tiltMin,

float tiltMax,

float tstep

)

{

/* adjust for numerical errors */

max += eps(max);

/* 3D rotation operators around X and Y axis */

Quaternion tiltx, tilty;

/* output array */

vectoroutput;/* set a quaternion value to represent a rotation around Y axis by the angle “aty”.
*
* Function Quaternion.set converts the angle/vector parameters into
* a “proper” Quaternion
*/
tilty.set(aty, 0.0, 1.0, 0.0);for (float atx = min; atx {
tiltx.set(atx, 1.0, 0.0, 0.0);
/* Quaternion product of three rotations */
Quaternion qtmp = untiltedOrientation * tiltx * tilty;
out.pushBack(qtmp);
}
}
return(out);
}
- Translational alignment and scoring
Each projection is translationally aligned against the corresponding tilted particle. The alignment is done by a cross-correlation pre-alignment followed by an optimisation of the Fourier phase residual with a Simplex minimiser running on two parameters in Fourier domain.
The value returned from the optimisation is a Fourier phase residual value (score) for a given predicted tilt. A complete set of such scores for a single particle yields a Phase Residual Landscape.
- Averaging of all Phase Residual Landscapes to obtain the Average Phase Residual Landscape
The overall Average Phase Residual Landscape plot is made by averaging all Phase Residual Landscape calculated for each submitted particle.
- Generating of the HTML output